Visual Analytics Final Project
Title: Exploring Violent Crime Rates in the United States: Insights from the USArrests Dataset
Introduction
Welcome to the exploration of violent crime rates in the United States using the "USArrests" dataset. In this blog post, we'll delve into the dynamics of violent crime across different states, exploring factors such as demographics, geographical patterns, and correlations between variables.
Problem Statement
The objective is to understand the factors influencing violent crime rates and identify patterns or trends that may exist across different states. By analyzing the "USArrests" dataset, the aim is to gain insights into the underlying drivers of violent crime in the United States.
Related Work
The analysis builds upon previous studies in criminology and data analytics. Similar research has explored the relationship between socio-economic factors and crime rates. We'll leverage existing visual analytics techniques, such as correlation matrices, to expand upon our analysis and uncover new insights.
Methodology
To solve the problem, we'll employ exploratory data analysis techniques using the "USArrests" dataset. Our approach will include descriptive statistics, correlation analysis, and spatial analysis to uncover patterns and relationships within the data. By utilizing techniques such as ranking, deviation analysis, and correlation analysis, we aim to identify key factors influencing violent crime rates.
Data Visualization and Discussion
Let's now dive into the visualizations of the "USArrests" dataset and discuss our findings:
1. Violent Crime Rates by State (Bar Chart):
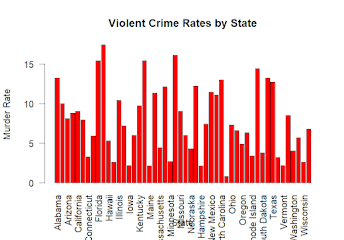
We'll visualize the violent crime rates across different states using a bar chart, allowing us to identify states with the highest and lowest crime rates. The bar chart displays the violent crime rates (specifically, the murder rate) for each state in the United States. By examining the heights of the bars, we can identify states with higher murder rates compared to others. For example, states with taller bars indicate higher murder rates, while states with shorter bars have lower murder rates. This visualization allows us to compare the relative severity of violent crime across different states.
2. Correlation Matrix (Heatmap):

By plotting a heatmap of the correlation matrix, we'll explore relationships between variables such as murder, assault, and rape rates, providing insights into potential factors driving violent crime. The heatmap of the correlation matrix shows the relationships between different variables related to violent crime, such as murder, assault, and rape rates. The color intensity of each cell indicates the strength and direction of the correlation between two variables. Darker shades represent stronger correlations, while lighter shades indicate weaker correlations. By examining the heatmap, we can identify which variables are positively or negatively correlated with each other. For example, a dark red cell indicates a strong positive correlation, while a dark blue cell indicates a strong negative correlation.
3. Crime Rates Distribution (Boxplot):

Conclusion
The analysis of the "USArrests" dataset has provided valuable insights into violent crime rates in the United States. By understanding the underlying factors and correlations between variables, we can better address the root causes of violent crime and work towards creating safer communities. Exploring the "USArrests" dataset further and conducting their analyses is encouraged. By sharing insights and collaborating, we can continue to advance our understanding of violent crime and drive positive change in society.
Comments
Post a Comment