Posts

Showing posts from April, 2024

Visual Analytics Final Project
Image
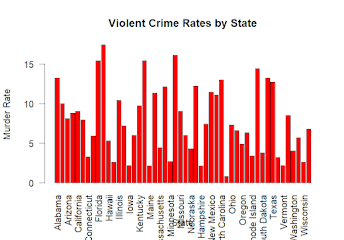
  Title: Exploring Violent Crime Rates in the United States: Insights from the USArrests Dataset Introduction Welcome to the exploration of violent crime rates in the United States using the "USArrests" dataset. In this blog post, we'll delve into the dynamics of violent crime across different states, exploring factors such as demographics, geographical patterns, and correlations between variables. Problem Statement The objective is to understand the factors influencing violent crime rates and identify patterns or trends that may exist across different states. By analyzing the "USArrests" dataset, the aim is to gain insights into the underlying drivers of violent crime in the United States. Related Work The analysis builds upon previous studies in criminology and data analytics. Similar research has explored the relationship between socio-economic factors and crime rates. We'll leverage existing visual analytics techniques, such as correlation matrices, to e

Module 13

 Creating a Simple Animation in R Introduction: In today's post, we'll explore how to create a simple animation in R using the animation package. Animation can be a powerful tool for visualizing data and conveying dynamic processes over time. Creating the Animation: We'll start by installing and loading the animation package. Then, we'll create a simple animation that plots random points with different colors. R Copy code # Install and load necessary packages install.packages("animation") library(animation) # Create animation saveGIF({   for (i in 1:10) {     plot(runif(10), ylim = 0:1, col = rainbow(10))     Sys.sleep(0.5)  # Pause for 0.5 seconds   } }, movie.name = "simple_animation.gif", interval = 0.5, ani.width = 600, ani.height = 400) Discussion: The animation consists of 10 frames, each displaying 10 random points between 0 and 1 on the y-axis. Different colors are assigned to the points using the rainbow() function. A pause of 0.5 seconds be

Module 12

  Creating Visual Social Network Analysis with RStudio  Introduction: In this blog post, we'll explore how to create a visual social network analysis using RStudio, a popular integrated development environment (IDE) for the R programming language. Visualizing social networks can provide valuable insights into the structure and connections within a network, making it easier to analyze and interpret complex relationships. Step 1: Install Necessary Packages: Before we begin, make sure you have the necessary packages installed. In RStudio, you can install packages using the install.packages() function. We'll need the following packages: GGally, network, sna, and ggplot2. R install.packages("GGally") install.packages("network") install.packages("sna") install.packages("ggplot2") Step 2: Load Required Libraries: Once the packages are installed, load them into your RStudio session using the library() function. R Copy code library(GGally) library